Which Health Numbers Are Worth Tracking at Home After 50?
The health metrics to track at home after 50 — blood pressure, resting heart rate, weight trend, waist-to-height ratio — and which numbers to skip.

Affiliate disclosure: This article contains affiliate links. As an Amazon Associate we earn from qualifying purchases, at no extra cost to you. Learn more.
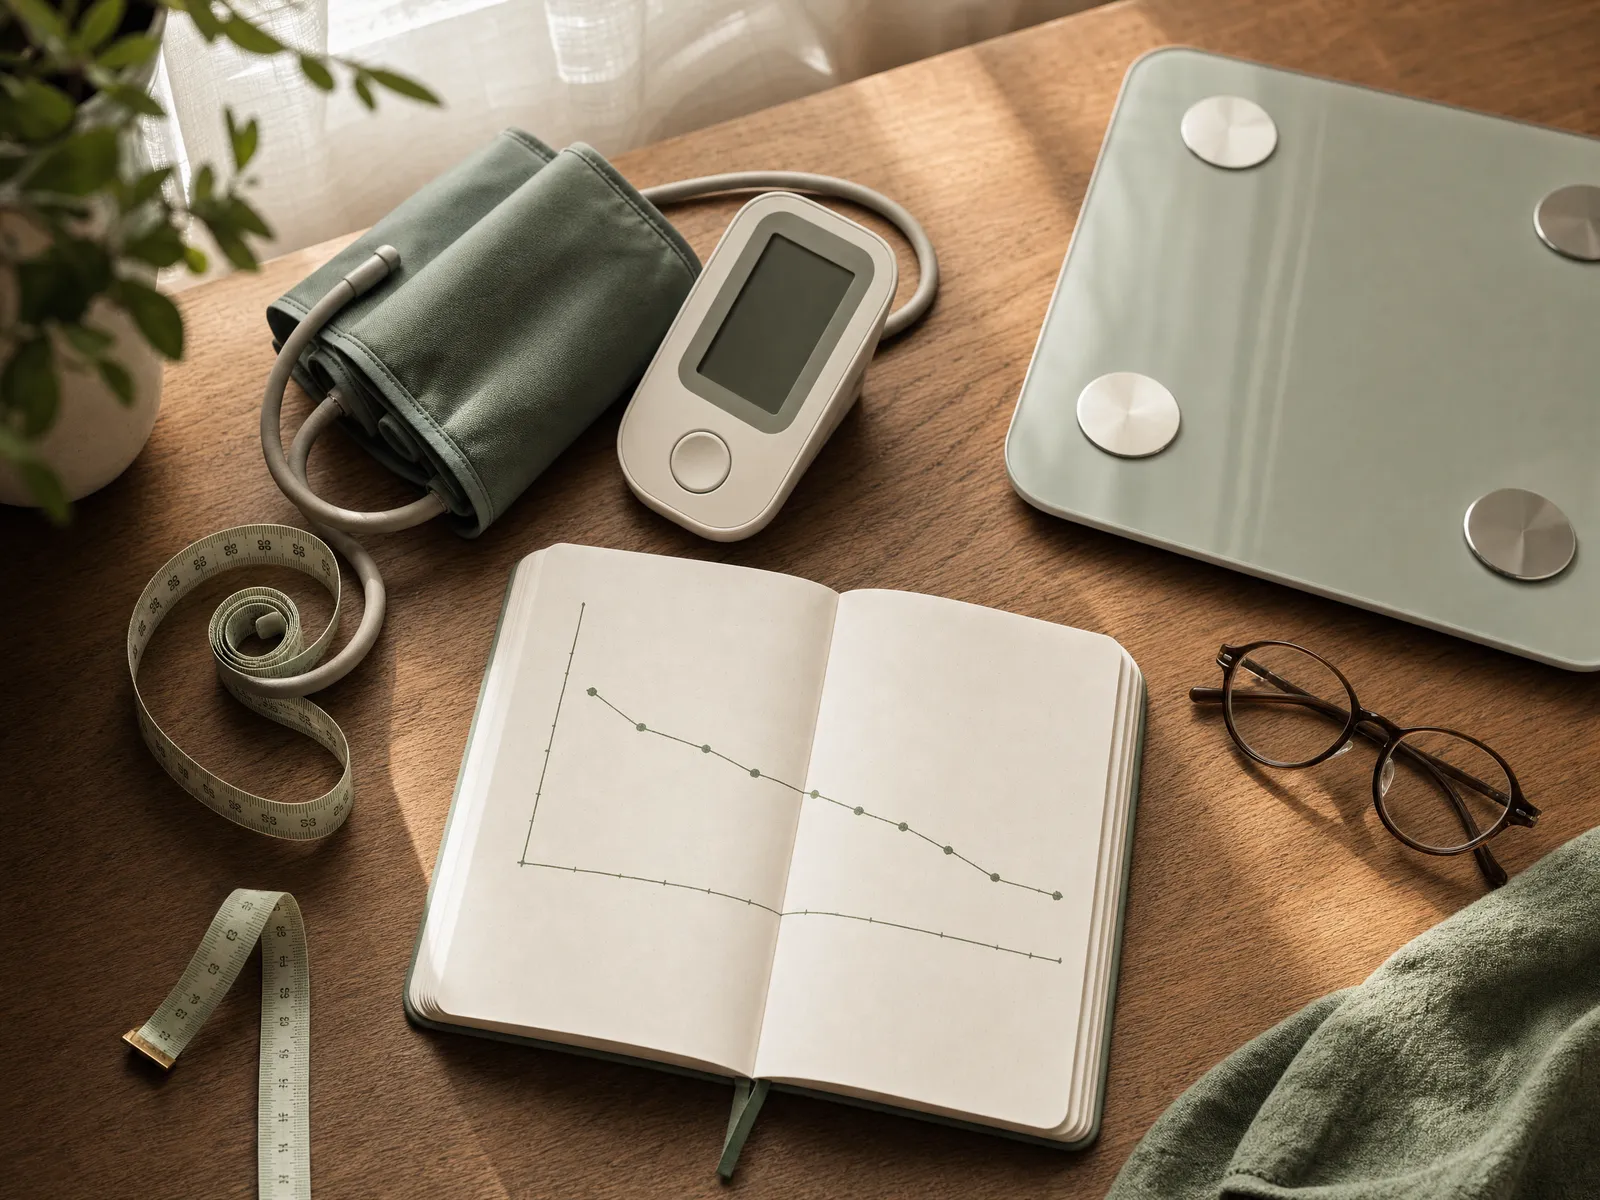
The health metrics to track at home that actually change a decision after 50 make a short list: blood pressure, resting heart rate and rhythm, your weight trend, and your waist-to-height ratio. Blood sugar joins the list only if you have a reason. Nearly everything else your devices report is context, entertainment, or noise.
That is a smaller list than your gadgets want to sell you. A modern wearable hands you a dozen daily scores, and almost none will ever be mentioned in a doctor's office. We spent this series on at-home health monitoring devices — what they measure and how accurate they are. This article answers what comes next: of everything a device can measure, which numbers earn a place in your week?
One ground rule. Home measurements produce data, not diagnoses. Every number below is something to bring to a clinician, not something to act on alone.
The short list: what to actually track
Here is the whole answer. The rest of the article is the reasoning and the caveats.
- Blood pressure — the one home number with guideline backing and a clear next step. Take a run of readings before appointments.
- Resting heart rate — free to collect passively, and the trend is what carries the signal. Collected daily, reviewed monthly.
- Heart rhythm — alerts catch episodes an office visit would miss. Passive; act on the alerts.
- Weight trend — direction over weeks is meaningful; one morning is not. Read the weekly average.
- Waist-to-height ratio — fills in what the scale leaves out, and takes 30 seconds with a tape. Every few months.
- Blood sugar — useful for some people, pointless for others. Only with a reason.
Notice what is missing: blood oxygen, body-fat percentage, sleep stages, HRV, and every proprietary wellness score.
Blood pressure: the highest-value number at home
If you track one thing at home, track this. For the general population, blood pressure is the home measurement with the strongest guideline backing — a defined target and a defined next step.
The 2025 high blood pressure guideline from the American College of Cardiology and the American Heart Association reaffirms a treatment target of less than 130/80 mm Hg, and — this is the part that matters for you — elevates home blood pressure monitoring to the diagnostic gold standard. The guideline is also written in terms of average readings rather than single ones. For people whose average readings fall in the 130–139/80–89 mm Hg range at lower cardiovascular risk, it recommends medication after 3 to 6 months of lifestyle change if blood pressure has not reached goal.
Your cuff is not a smoke alarm. It is an instrument for producing an average a clinician can compare against a threshold.
Three practical consequences:
- A single reading is nearly meaningless. Blood pressure moves all day — with posture, caffeine, conversation, a full bladder. One number describes one minute.
- The device type is not a free choice. The American Heart Association recommends an automatic, cuff-style, upper-arm monitor. Wrist and finger devices are easier to get wrong.
- The AHA recommends home monitoring for everyone with high blood pressure — to see whether treatment is working, and to help confirm a diagnosis.
An unvalidated or badly sized cuff produces a confident wrong number rather than an obvious error, so the equipment is worth getting right once. Our picks are in the guide to the best home blood pressure monitor options, chosen on independent validation rather than features.
Resting heart rate and heart rhythm
Two different numbers with two different jobs — and people routinely confuse them.
Resting heart rate is a slow-moving baseline. According to the American Heart Association, a resting heart rate between 60 and 100 beats per minute is normal for most adults, and it can be affected by stress, anxiety, hormones, medication, and how physically active you are. That is a wide band by design — where you sit inside it matters far less than whether you are drifting.
The drift is the point. American Heart Association News has covered research suggesting that an abnormal resting heart rate over the long term may predict future heart failure or death — the kind of pattern a wearable catches well, because it collects the number nightly without you thinking about it. A resting rate that has climbed several beats over months, with no change in fitness, illness, or medication, is worth raising at your next appointment.
Heart rhythm is a different animal. An irregular-rhythm notification from a watch or a single-lead recorder can catch an episode that would never happen during ten minutes in an exam room. Our view: treat an alert as a prompt to call someone, and treat the absence of alerts as no evidence of anything. These features are cleared for narrow, specified uses and do not replace a clinical work-up.
Weight trend (not weight)
The heading is the argument. Your weight today is corrupted by hydration, salt, food volume, and what time you stood on the scale. Your weight averaged across a week is a real signal.
Most people track this backwards: they weigh daily, then react to the daily number — the part of the data carrying the least information. The fix is not weighing less often, but weighing under the same conditions and reading the line, not the dot. That is why we like scales that log to an app: not for the body-composition extras, but because software averages without arguing. Our reviews of smart scales cover which ones do the trend well.
Two honest caveats. Body composition numbers deserve far less trust than the weight itself — consumer scales infer body fat from the resistance your body offers a small electrical current, which is sensitive to hydration and to the manufacturer's formula. Watch the direction over months; do not treat the decimal place as a measurement.
And daily weighing is not right for everyone. If a scale reliably ruins your morning, or if you have a history of disordered eating, this metric may cost more than it returns — a conversation worth having with your clinician rather than a habit to force.
Waist-to-height ratio: the measurement most people skip
The highest value-per-effort number in this article, and almost nobody tracks it: a tape measure, thirty seconds.
The UK's National Institute for Health and Care Excellence recommends in its overweight and obesity guideline (NG246) that adults keep their waist-to-height ratio below 0.5 — communicated in the memorable form "keep your waist to less than half your height." NICE classifies the ratio into bands: 0.4 to 0.49 is healthy central adiposity with no increased health risks, 0.5 to 0.59 is increased central adiposity indicating increased risks, and 0.6 or more is high central adiposity indicating further increased risks.
Two things make it useful where BMI is not. NICE notes that the same classification applies across all ethnicities and sexes, and that it can help with adults who have high muscle mass, in whom BMI is less accurate. (NICE applies these bands alongside BMI in adults with a BMI under 35 kg/m².) It also measures where the weight sits, not just how much there is.
One caveat: this is a UK guideline, and US bodies more often frame the same idea through waist circumference alone. If your clinician uses a different measure, bring the tape measurement anyway. Because the ratio moves slowly, every few months is plenty.
Blood sugar: who benefits from tracking and who does not
Blood sugar is where home tracking splits hardest between "genuinely valuable" and "expensive curiosity."
Start with the thresholds. According to the American Diabetes Association's Standards of Care in Diabetes, an A1C of 5.7–6.4% is one of the markers that defines prediabetes (fasting and post-load glucose values are the others), and an A1C of 6.5% or higher is one of the criteria for diagnosing diabetes. A1C is a laboratory number your clinician orders — it reflects average glucose over months, and no wearable estimates it.
If you have diabetes, home glucose tracking is part of care rather than optional enrichment, and the target is set with your clinician rather than by an app. Continuous glucose monitors have their own metrics: the ADA's 2026 Standards of Care note that for older adults with complex or intermediate health using a CGM, the recommended time in the 70–180 mg/dL range is at least 50%, or about 12 hours a day — deliberately looser than the target used for younger, healthier adults. That is the whole point: glucose goals are individualized, and copying someone else's is a mistake.
If you have neither diabetes nor prediabetes, the case gets much weaker. Over-the-counter continuous glucose monitors are now sold directly to people with no diagnosis, and the honest position is that evidence they improve health outcomes in that group is thin. What they reliably show is how specific meals affect you. Our view: treat one as a short education experiment with an end date, not a metric you keep forever — and expect variation that means nothing, because glucose moves constantly in people without diabetes.
Sleep, steps, and the numbers that are motivational rather than clinical
Sleep duration and step counts belong in a separate category, and that category is not "useless" — it is "useful for behavior, not diagnosis."
We are deliberately not handing you a step target. The figures you see quoted are not clinical thresholds the way 130/80 mm Hg is; they are round numbers that work as motivation. That is a legitimate job: seeing a low count at 4 p.m. and taking a walk is a real benefit that does not require step-level accuracy.
Sleep is similar, with one added warning. Total time asleep is roughly measurable by a consumer device. Sleep stages are not, at least not to the precision the graphs imply. If a tracker says you slept five hours when you were in bed for eight, that is worth noticing. If it says you got 47 minutes of deep sleep, that is an estimate dressed up as a measurement.
The failure mode is common: people optimize for the score. If chasing a sleep score makes you anxious at bedtime, the tracker has traded your sleep for a graph — turning it off is a legitimate outcome.
Numbers that are not worth tracking at home
This section saves the most money.
- Blood oxygen (SpO2) if you are a healthy adult with no lung or heart condition. The FDA is explicit for consumers: "Do not rely only on a pulse oximeter." It notes that accuracy can be affected by poor circulation, skin pigmentation, skin thickness, skin temperature, current tobacco use, and fingernail polish, and that evidence suggests pulse oximeters may be less accurate in people with darker skin pigmentation — the agency issued draft guidance in January 2025 aimed at improving performance testing across skin tones. A diagnosed respiratory condition and a clinician who wants readings is a different situation entirely.
- Body-fat percentage to one decimal place. See above — watch the direction, ignore the precision.
- Sleep stage breakdowns. Interesting graphics, weak measurement.
- Heart rate variability as an absolute number. HRV varies enormously between people. Only your own baseline means anything, and even that responds to alcohol, illness, and a late meal as readily as to exercise.
- Any single blood pressure reading. It is not a number, it is a moment. Guidelines are written around averages.
- Proprietary composite scores — readiness, body age, wellness index. Unvalidated blends of the metrics above, and no clinician can interpret them because nobody outside the company knows the formula.
- Cholesterol, by home kit. Lipids are a blood-draw number interpreted alongside your other risk factors. There is no home-tracking version of that conversation — ask your clinician what schedule is right for you.
The devices are not frauds. Most of what they display is a byproduct of the few things they measure well.
How often to check each one
Check each number as often as it actually changes, and no more. Blood pressure moves minute to minute, so it needs a cluster of readings to make a usable average. Waist-to-height ratio moves over months, so weekly measurement tells you nothing.
- Blood pressure — a run of readings before an appointment or after a treatment change, because guidelines act on averages.
- Resting heart rate — passive, reviewed monthly; only multi-month drift tells you anything.
- Heart rhythm — passive, with alerts switched on. You are waiting for an event, not watching a number.
- Weight — same conditions each time, and read the weekly average. Daily noise swamps the trend.
- Waist-to-height ratio — every few months. It changes slowly.
- Blood sugar — per your clinician, or a short CGM trial. Targets are individualized.
- Sleep and steps — passive; glance weekly. This is behavioral feedback, not diagnostics.
- A1C and lipids — lab work on your clinician's schedule. These are not home measurements.
That list is our editorial view of a reasonable rhythm, not a medical instruction. If your clinician has asked for a specific schedule, theirs wins every time.
Bringing your numbers to your doctor
Collecting the data is the easy half. Presenting it so that it gets used is where most home tracking quietly fails. Appointments are short, and a phone handed across a desk mid-consultation is the least useful format there is. One page works better.
- Lead with averages, not exports. "My morning average over the last seven days was 138/84" is usable; three hundred rows of spreadsheet is homework for someone with fifteen minutes.
- Include dates and conditions. When you measured, on which arm, and whether it was before or after medication.
- Flag what changed. A new prescription, a dose change, a bad flu, a stressful fortnight. Context is often the finding.
- Bring the device if the readings are surprising. A clinician can compare your cuff against theirs in a minute, settling the "is my monitor wrong?" question that otherwise eats the visit.
- Say what you want from the data. "Should I be measuring at all?" is a fair question, and the answer is sometimes no.
If your averaged readings sit at or above the guideline threshold, climb steadily, or come with symptoms, contact your clinician rather than waiting for a scheduled visit.
The bottom line: fewer numbers, checked properly
The reader who gets the most out of home monitoring is not the one with the most sensors. It is the one who tracks blood pressure properly, watches a weight line instead of a weight, measures a waist once a quarter, and ignores the rest with a clear conscience.
Starting from nothing? A validated upper-arm cuff and a tape measure cover the two numbers with the strongest guideline backing, for well under the price of a smartwatch. To add something later, how to choose a home health monitoring device walks through the order of operations — health question first, validation second, features last — and our home health monitoring guide covers each category in depth.
And if the honest answer is that none of these numbers would change anything you do, that is a legitimate result too. The goal was never a fuller dashboard. It was a shorter, more useful conversation with the person who treats you.
Keep reading
Smart Rings vs. Smartwatches for Health Tracking: Which Is Right for You?
Smart ring vs smartwatch: rings win on comfort, sleep tracking, and battery life; watches win on real-time data, GPS, and safety. Here is how to choose.
Are Home Health Devices Covered by Medicare, FSA, or HSA?
Are home health monitoring devices covered by Medicare? Usually not. But FSA and HSA dollars cover far more. Here is what each program actually pays for.
How to Choose a Home Health Monitoring Device
How to choose a home health monitoring device: start with the health question you need answered, then buy the validated, correctly sized, readable model.